UDP Emitter Signal Characterization Results
Description:
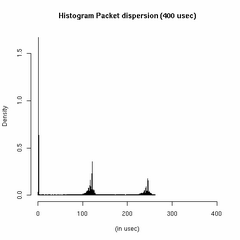
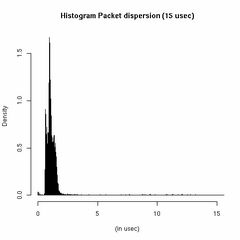
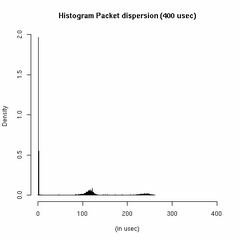
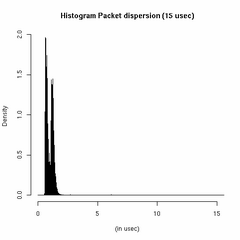
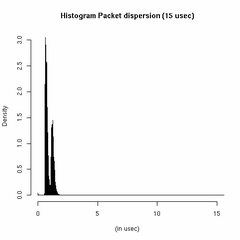
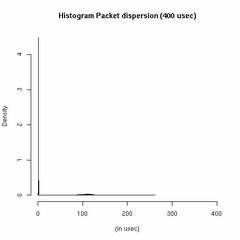
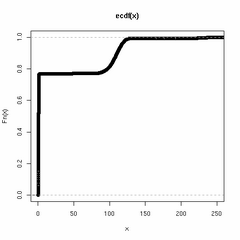
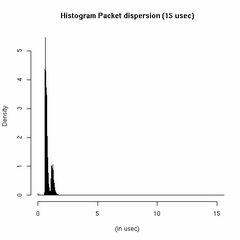
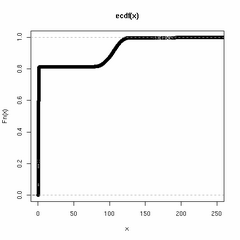
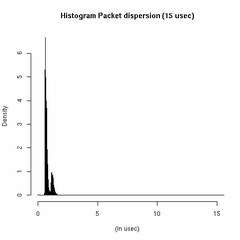
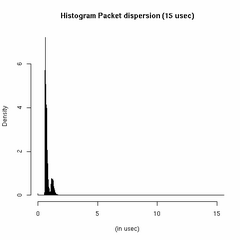
The results here show the effect of interrupt coalescing in measurements at the NIC layer. Basically, as we can see in the smallest granularity histograms, we have packets 3-5 usecs apart, but this should be impossible under per packet interrupt, therefore we suffer some interrupt coalescing (Intel 1000MT card have an absolute, per packet and throttle interrupt delays). The results are under a variety of offered loads 100Mbps to 1000Mbps.
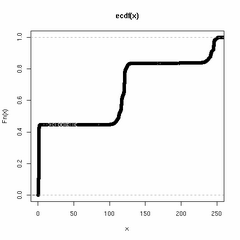
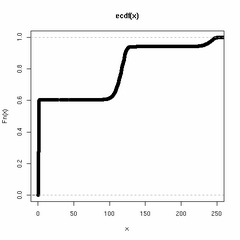
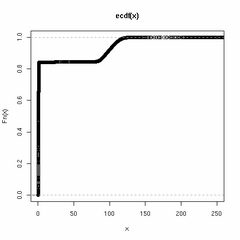
in order Histogram (1 msec) (30usec) and Empirical CDF (800usec)
in order Histogram (1 msec) (30usec) and Empirical CDF (800usec)
in order Histogram (1 msec) (30usec) and Empirical CDF (800usec)

in order Histogram (1 msec) (30usec) and Empirical CDF (800usec)

in order Histogram (1 msec) (30usec) and Empirical CDF (800usec)

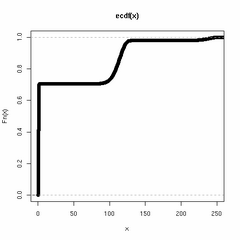
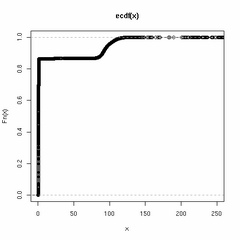
in order Histogram (400 usec) (30usec) and Empirical CDF (800usec)

in order Histogram (400 usec) (30usec) and Empirical CDF (800usec)

in order Histogram (400 usec) (30usec) and Empirical CDF (800usec)


in order Histogram (400 usec) (30usec) and Empirical CDF (800usec)
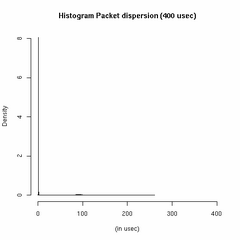
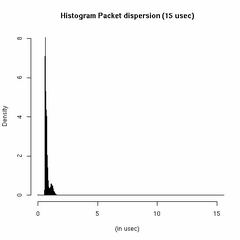
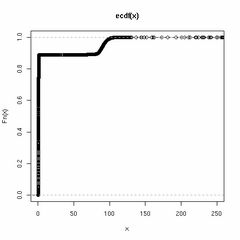
in order Histogram (400 usec) (30usec) and Empirical CDF (800usec)


