UDP Emitter Signal Characterization
Description:
In this section, we study the behavior of a "pure signal", no extra machine load is inserted in the experiment. We capture the behavior of the received packets from the ethernet point of view (using packet dispersion measure) whenever we are transmitting a UDP flow of 100Mbps, 200Mbps, etc (using thrulay) and compare with the scheduling behavior from the receiver. We also tested using the tool Crude/Rude [rude.sourceforge.net] but the results show that this tool is inadequate, not updated for high speed, since it cannot reach 100Mbps of throughput.
Rate = 10Mbps 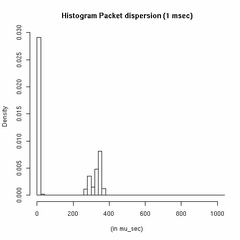
In order to capture the signal from the receiver point of view, basically we instrumented modifications of FreeBSD 5.4 kernel. We obtain the real time clock and calculate the difference between consecutive packets arrivals. In terms of topology, we used machine 1 => sending to => machine 2 (see testbed section) and both machines were in single user mode (no other process were active).
In order to understand the nature of machine noise in network transmissions we first characterize the scheduling rate from the sender. It is important to note that the UDP sending rate of thrulay is based on a Poisson process. The following graph (below) plots the variable target_tick that schedules packet transmissions according to the specified UDP rate. [Thrulay code, line 493-514].
Rate = 100Mbps 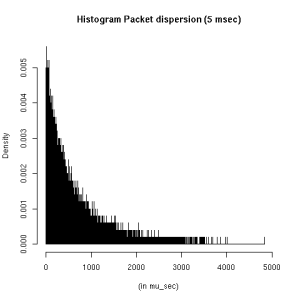
Rate = 200Mbps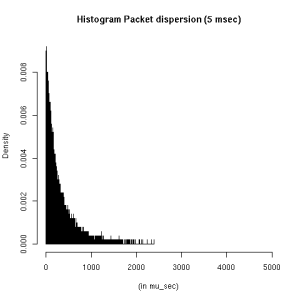
Rate = 300Mbps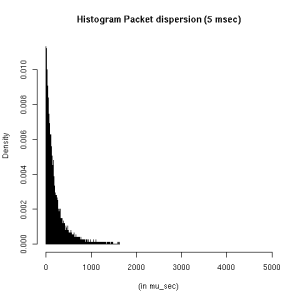
We generate 2 sets of tests
= one) logging the packet dispersion directly to the /var/log/messages and
= second) the same set of tests was executed using a RAMDisk.
From the results, it seems that using FreeBSD 5.4 there is no much difference in logging the packet dispersion through file system or ramdisk. We intend, in the future, include the results were all dispersions are stored in memory directly, without calling the log system call.For each experiment, we changed the throughput parameter of thrulay (-u 100M, 200M, etc) and we plotted the receiver consecutive packet dispersion at ethernet level. The final graphs are time-series diagrams and histograms using 3 different granularities (due to outliers) - 5 msec, 1 msec and 40usec. All the post-processing scripts to generate these graphs can be downloaded here. Following is the list of diagrams. *One observation is that when we run the experiments at high speed 800-900Mbps a lot of packets were dropped in the sender side (we might have to expand the buffers).