Internal IP Queueing Delays Characterization (FreeBSD 5.4)
Description:
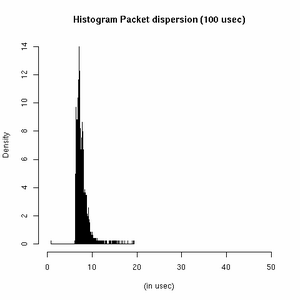
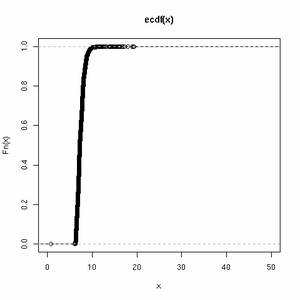
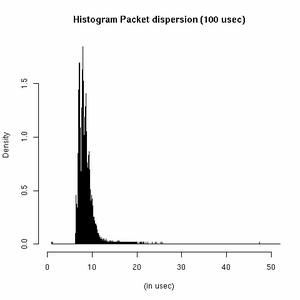
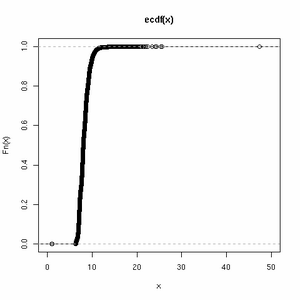
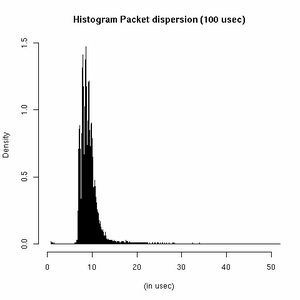
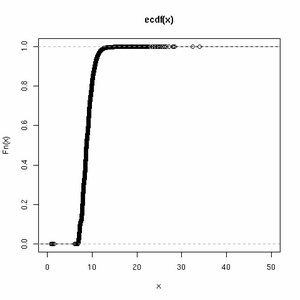
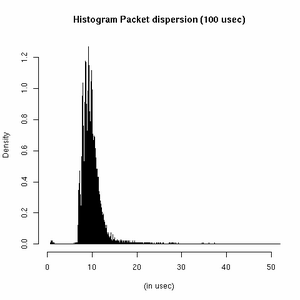
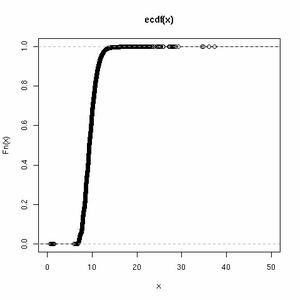
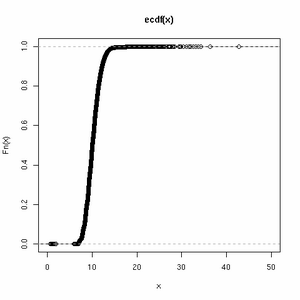
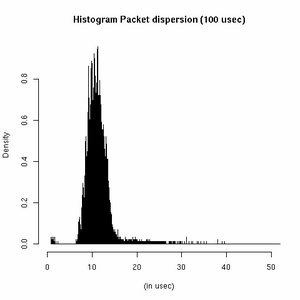
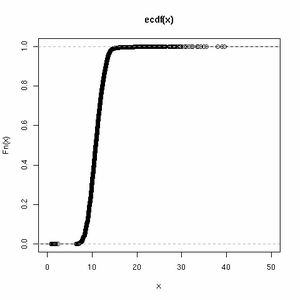
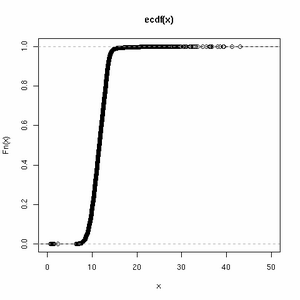
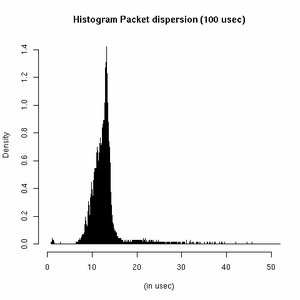
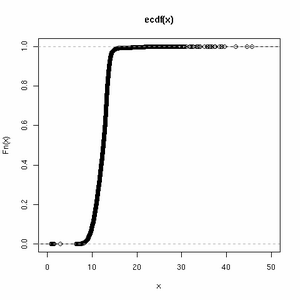
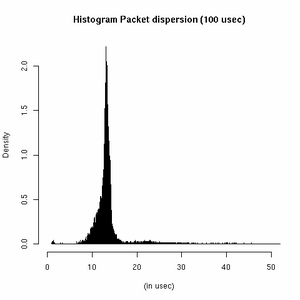
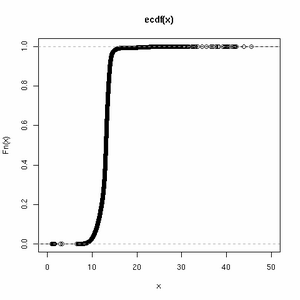
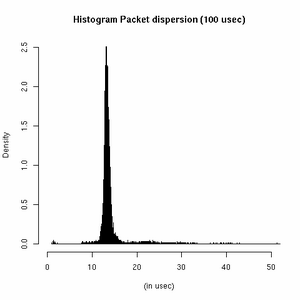
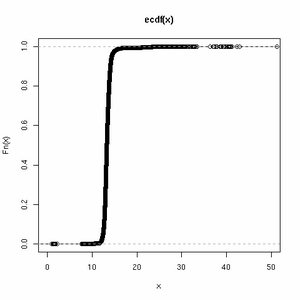
In this section, we study the behavior of the internal delays inside the FreeBSD UDP stack. We do generate any other debugging log (so, there a slight different of about 15-20usec due to logging in the ip layer). We tested over a broad offered load varies from 100Mbps all the way to 1000Mbps. The traffic pattern is poisson, but that shouldn't matter since in this experiment we are eager to obtain the internal IP queueing delays under different loads. The following graphs present the histogram (in 100usecs granularity) and the Empirical CDF (in 10-60usec granularity).
Rate = 100Mbps in order (eth->udp) histogram (100usec) empirical CDF (10-60usec)
Rate = 200Mbps in order (eth->udp) histogram (100usec) empirical CDF (10-60usec)
Rate = 300Mbps in order (eth->udp) histogram (100usec) empirical CDF (10-60usec)
Rate = 400Mbps in order (eth->udp) histogram (100usec) empirical CDF (10-60usec)
Rate = 500Mbps in order (eth->udp) histogram (100usec) empirical CDF (10-60usec)
Rate = 600Mbps in order (eth->udp) histogram (100usec) empirical CDF (10-60usec)
Rate = 700Mbps in order (eth->udp) histogram (100usec) empirical CDF (10-60usec)
Rate = 800Mbps in order (eth->udp) histogram (100usec) empirical CDF (10-60usec)
Rate = 900Mbps in order (eth->udp) histogram (100usec) empirical CDF (10-60usec)
Rate = 1000Mbps in order (eth->udp) histogram (100usec) empirical CDF (10-60usec)